What's triggering my GitHub API rate limit?
I was happily hacking away at INAV‘s codebase, and as usual I fired up its configurator to test some changes. When trying to flash my build, though, I noticed something weird: the dropdowns that are usually populated by the project’s GitHub releases wouldn’t load and the log pointed to a rate limiting issue.

“API rate limit exceeded for 198.51.100.42. (But here’s the good news: Authenticated requests get a higher rate limit. Check out the documentation for more details.)”
I didn’t think too much of that, I had to flash my local build without losing my train of thought - “I’ll get back to that later, it’s probably just some development tool misbehaving” was quickly appointed as a solution and I forgot about it all. In the following months the issue cropped up again every now and then, but since this kind of things are subtle enough to manifest themselves only when you’re working on something else that had to ship yesterday, I usually fell back to firing up my VPN of choice for a couple of seconds and temporarily circumventing the root cause of the problem rather than properly investigating on what was actually causing the (unwanted, presumably?) traffic.
This morning I was doing some maintenance on other systems and it seemed a good moment to spend a couple of minutes investigating the issue; before I knew it the sun had set, I had skipped lunch, and several notifications had piled up on my smartphone. Business as usual. *Dramatization*
It’s always DNS
In the quest of figuring out what was calling GitHub’s APIs frequently enough to exceed their unauthenticated quotas, the first step was locating the machine that was actually generating the traffic.
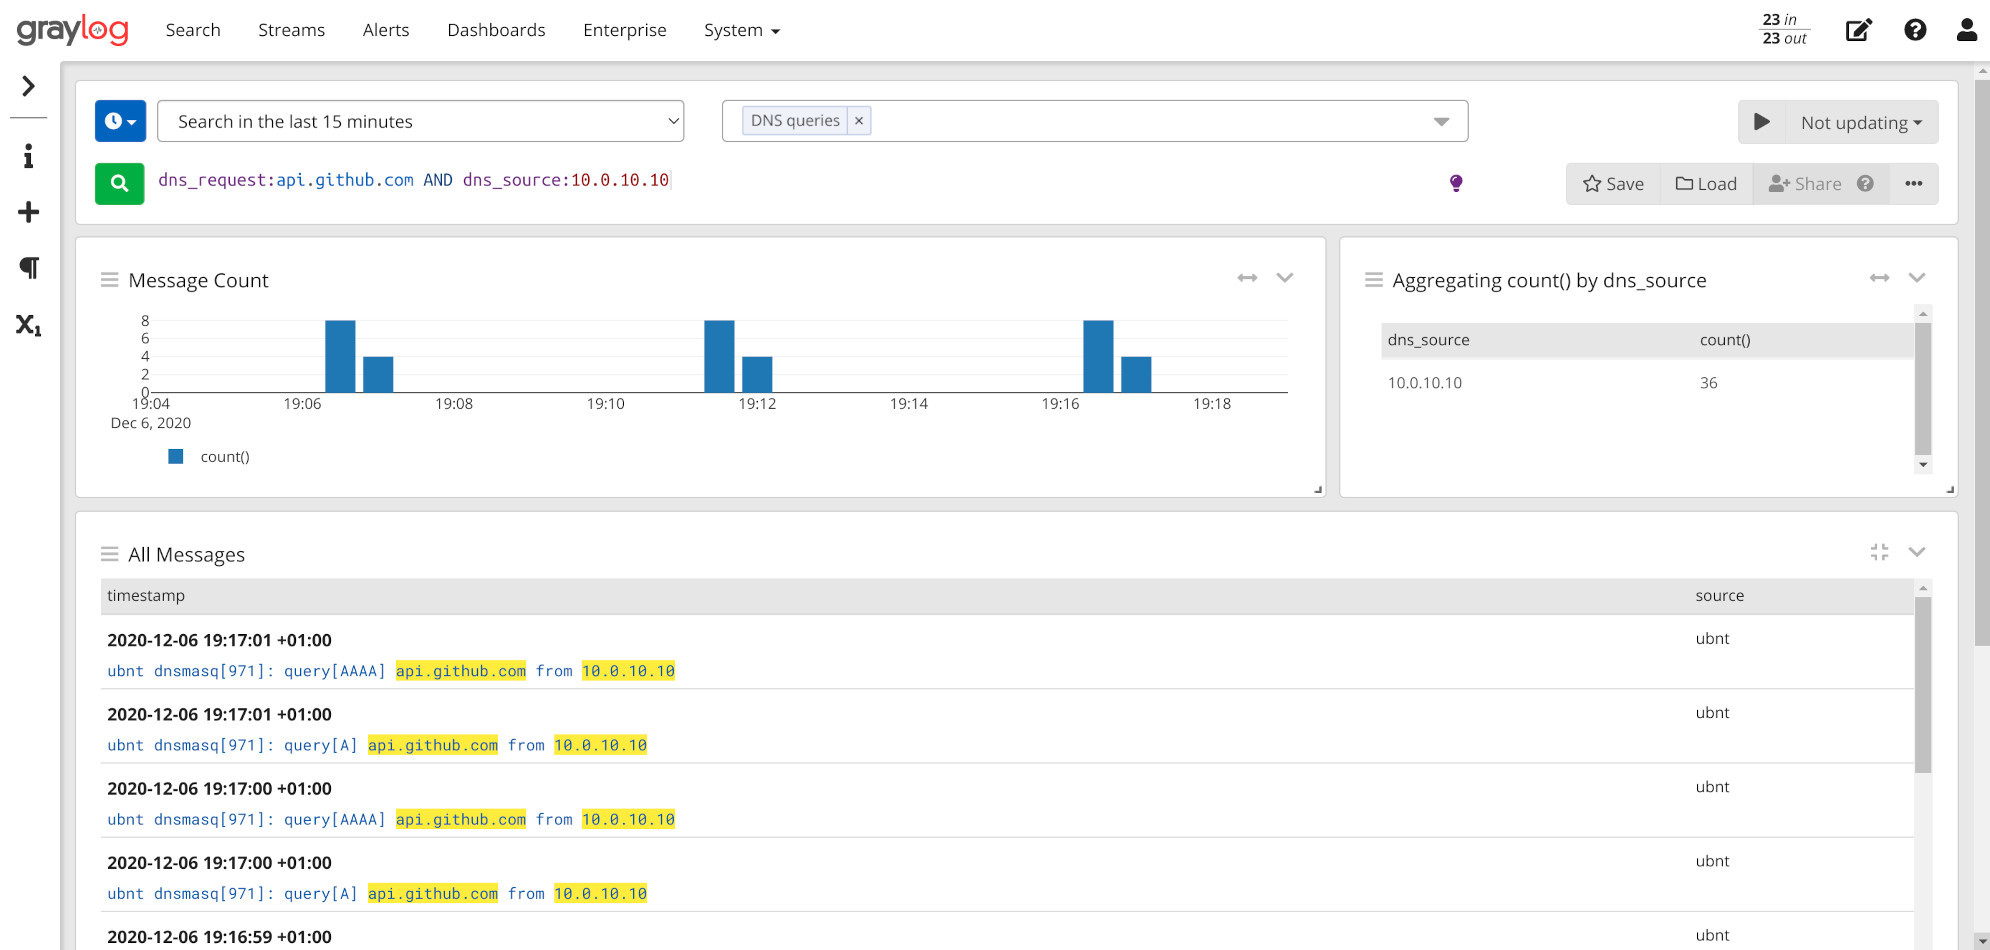
Fortunately I had already set up DNS logging on my router - see “Logging DNS queries on your EdgeRouter” - so it was just a matter of pulling up Graylog and sifting through a bit of data. A simple aggregation swiftly pointed out the suspect: something on 10.0.10.10 was hitting GH every 5mins on the dot.

Since that IP unsurprisingly matched my main homelab server that hosts a mix of VMs, LXC and Docker containers via Proxmox and Rancher v1, my bets were on a misconfigured update check hidden somewhere in one of those.
Brutef… Erm, binary search
Hoping for a quick solution and taking full advantage of this being a domestic/homelab environment, I first tried the easiest way of locating the misbehaving service: shutting everything down in pools of related services until the issue disappeared.
LXC containers down? No, queries were still there. VMs halted? Nope. Docker containers stopped? Neither. This only meant one thing: the issue was either on bare metal or in the hypervisors/orchestrators themselves. Crap.
By the powers of cross-referencing logs
After some research on the topic and some painful tinkering with auditd and iptables, it was clear that I couldn’t piece together PIDs and their network packets contents in a simple way. Fortunately I also came across this interesting SystemTap script mentioned in a not-so-related ServerFault question. I never had the need to use SystemTap before, but it surely sounded like the right tool for the job:
SystemTap provides free software (GPL) infrastructure to simplify the gathering of information about the running Linux system. This assists diagnosis of a performance or functional problem.
[…]
SystemTap provides a simple command line interface and scripting language for writing instrumentation for a live running kernel plus user-space applications.
The version of SystemTap currently available in Debian 10 repos is too old to support 5.x kernels - it just happily sits there for a minute without outputting anything and eventually crashes, leaving you wondering what the hell happened - and the backports packages had some other obscure library dependency problems. Fortunately our favorite series of tubes has a solution for everything and manually compiling the tool was enough to get it running smoothly.
Here’s the aforementioned script, noobly modified to prepend a timestamp to logged entries:
1 |
|
Pointing it at that subnet’s router and DNS resolver and letting it run for a couple of minutes started to produce some useful logs:
1 | ./who_sent_it.stp -G the_daddr=10.0.10.1 -G the_dport=53 |
1 | [...] |
Nice! I finally had process-network references! But what about actually knowing what’s in those DNS requests? tcpdump to the rescue.
1 | tcpdump -i vmbr0 -l port 53 2>/dev/null | grep -i -A 1 github |
1 | 19:38:11.479875 IP my.homelab.srv.39420 > 10.0.10.1.domain: 8073+ A? raw.githubusercontent.com. (43) |
Having sourced both groups of informations that were needed, it was now just a matter of waiting for a request to GH’s APIs to come up in the output of tcpdump and checking what was happening at the same time in stap’s logs.
Given the log entries above, the only processes that issued DNS requests in a reasonable time interval (±2s in a low traffic environment like this, accounting for instrumentation-induced slew) were a random python process, reader#1 (probably Graylog’s own stuff), grafana-server, and rancher-dns.
1 | Sun Dec 6 19:48:09 2020 CET - python[1756848] sent packet to 10.0.10.1:53 |
Grafana wouldn’t have many reasons to reach out to GH, just like Graylog. I didn’t investigate the Python process, but its tree could have been explored since the PID was known. What was left was that suspicious rancher-dns entry, almost surely related to the aforementioned container orchestrator I use.
Raging cattle
As I was tinkering with Rancher’s settings searching for its DNS logs, it struck me: Rancher uses “catalogs” to list deployable application templates, a bit like Helm does with its “charts” for K8S, and in the end those catalogs are nothing more than… GitHub repos! Sure enough, I’m using a couple of custom catalogs:

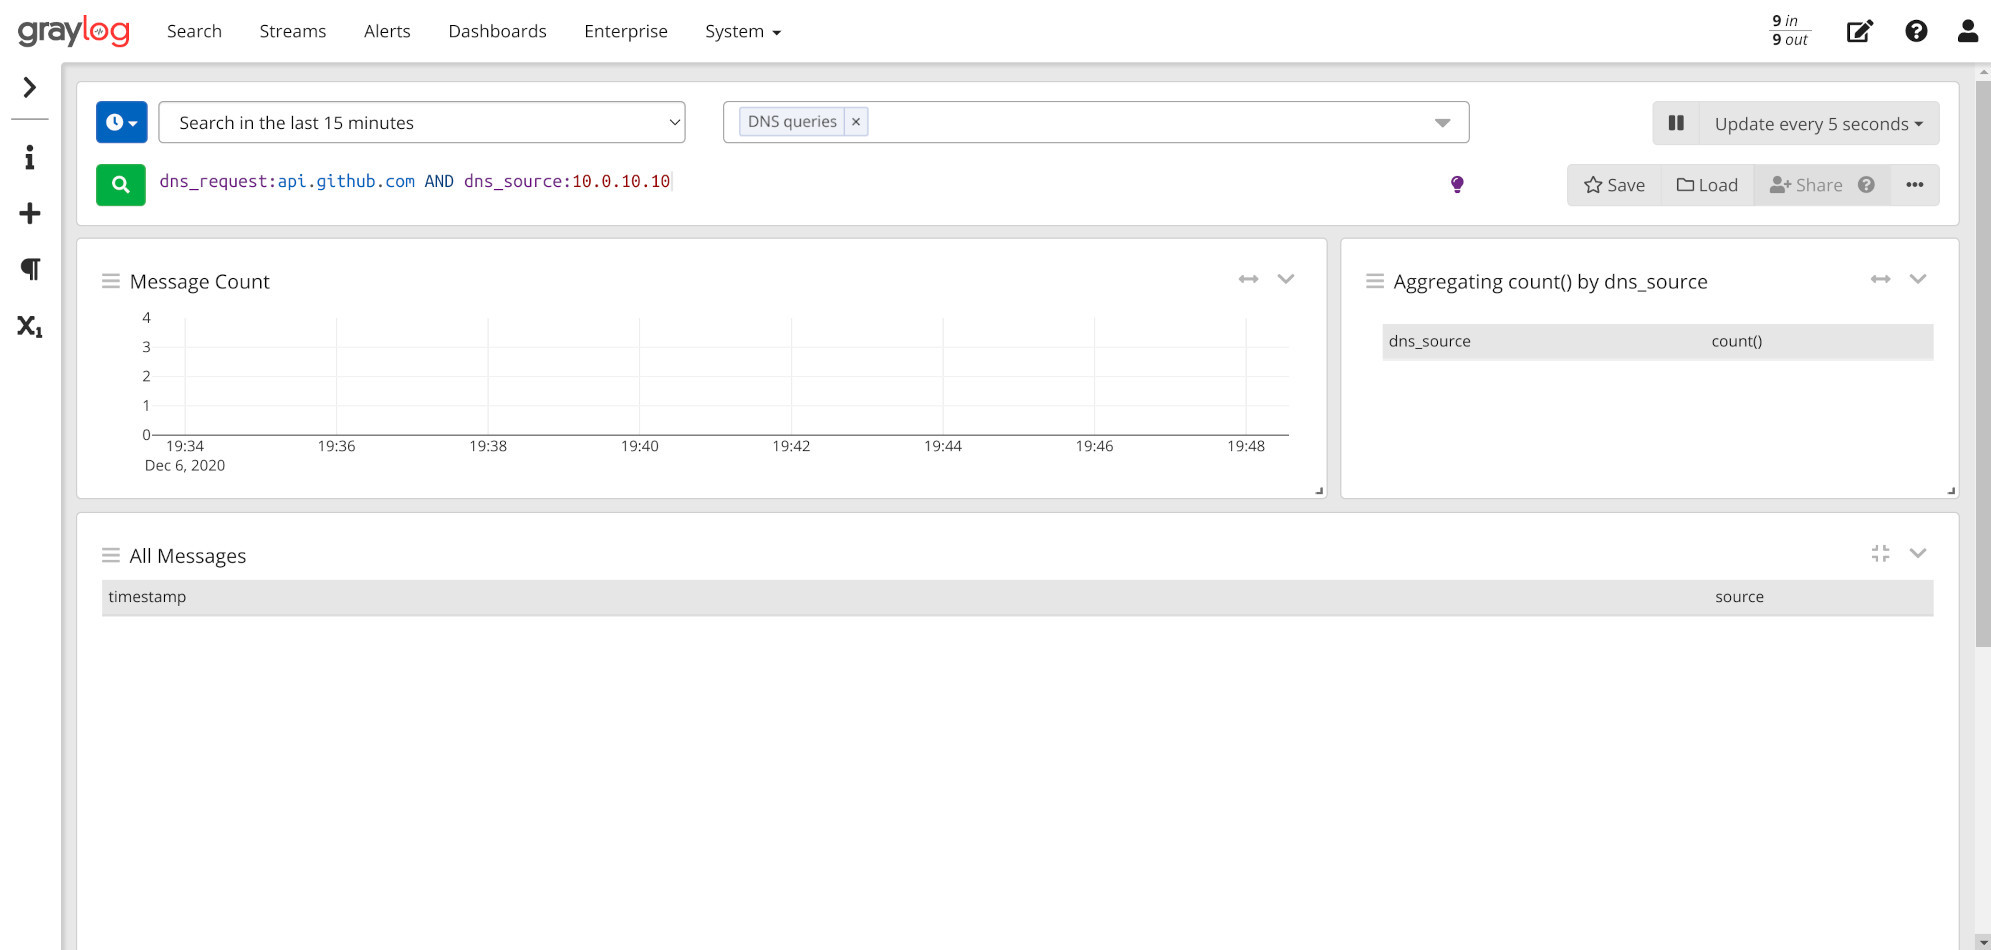
Stopping the whole orchestrator was in fact making the rogue requests disappear, so at this point I was pretty sure that this was where the problem lied. After poking around for a bit I found an undocumented catalog.refresh.interval.seconds setting in an internal API that was set to, no surprise, 300 seconds! Boom, mistery solved. ![]() Applying a more suitable refresh interval of 4 hours mitigated the problem just fine.
Applying a more suitable refresh interval of 4 hours mitigated the problem just fine.
An afternoon spent tracking down a pesky networking issue finally paid off: no more insanely frequent update checks (my initial suspicion was spot on!), my logging and monitoring stack did its job excellently and I even got to play with some new tools in the process. I’m sure this technique will come in handy sometime later on, and I hope it’ll be useful to you too.
Before

After
